 |
Market Junkie Mobile stocks & markets on your iPhone |
Charts
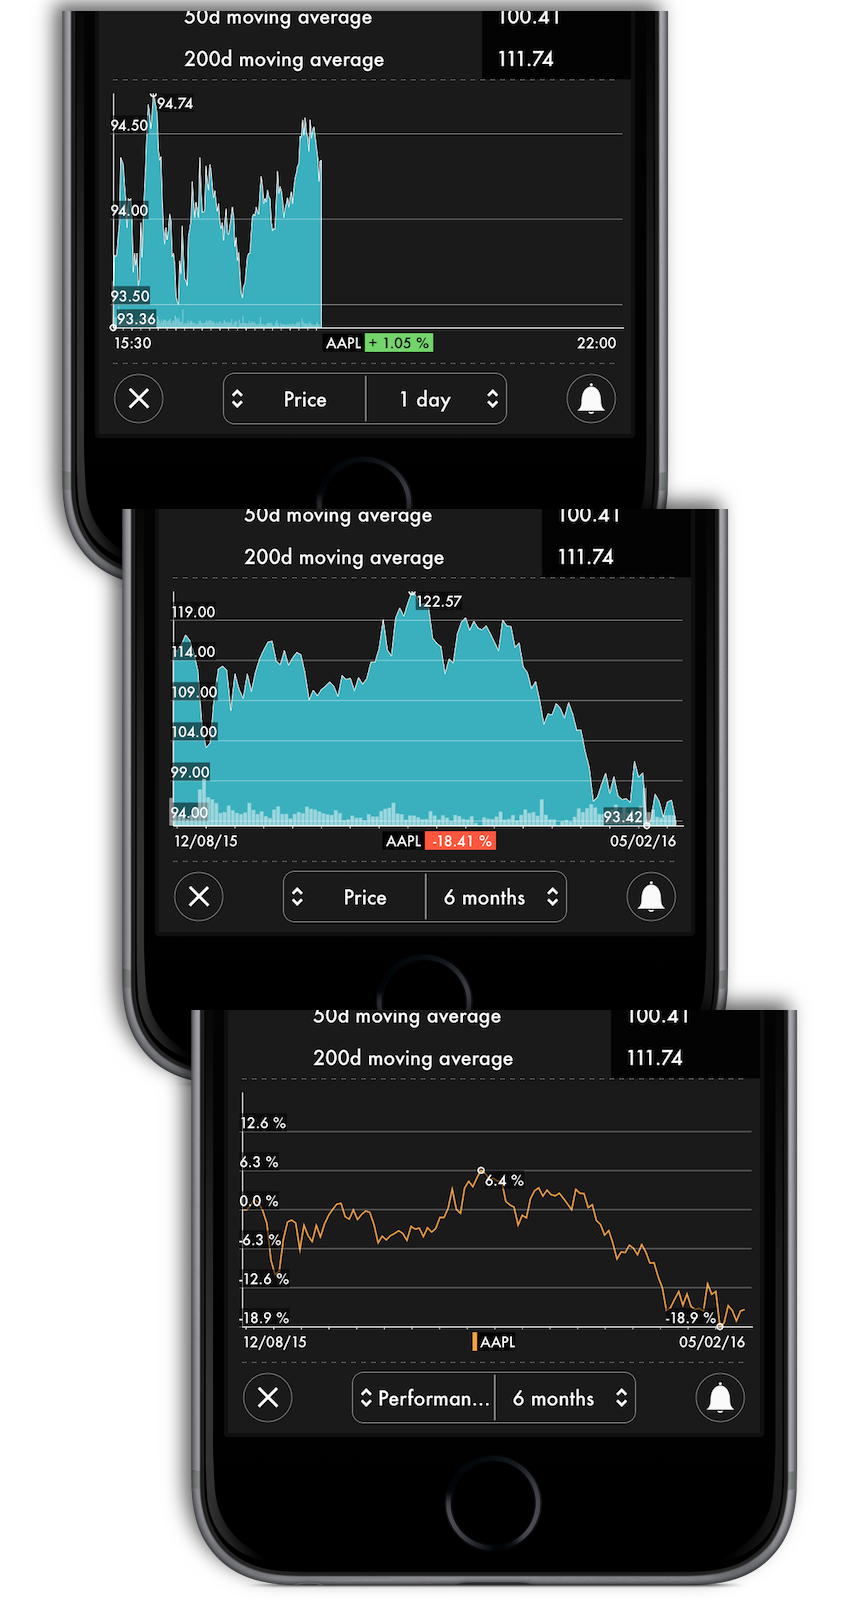
Charts are a very important piece of information when it comes to finances and investment decisions. That's why we put a lot of care and detail in our charts. To make them easily readable and elegant, while still containing a lot of valuable data.
In our charts we've included more information than just the price and it's development over time. You'll find the time frame, percent change during that time frame, minimum and maximum value, and since version 1.2 the volume of trading in this stock.
You can choose between several different time frames, spanning one day, several days months or years. And to add another level of perspective, we've included a second type of chart we call 'performance'. This chart will show you the percentage change from the given start date over time, again including minimum and maximum values.
Pro tip: Tap and hold on a chart lets you share this particular chart via email, message, twitter or other means.